pygmt.Figure.choropleth
- Figure.choropleth(data, column, cmap=True, **kwargs)
Plot a choropleth map.
This method is a thin wrapper around
pygmt.Figure.plotthat sets the appropriate parameters for creating a choropleth map by filling polygons based on values in a specified data column. It requires the input data to be a geo-like Python object that implements__geo_interface__(e.g. ageopandas.GeoDataFrame), or an OGR_GMT file containing the geometry and data to plot.- Parameters:
data (
GeoDataFrame|str|PathLike) – A geo-like Python object which implements__geo_interface__(e.g. ageopandas.GeoDataFrameorshapely.geometry), or an OGR_GMT file containing the geometry and data to plot.column (
str) – The name of the data column to use for the fill.cmap (
str|bool, default:True) – The CPT to use for filling the polygons. If set toTrue, the current CPT will be used.**kwargs – Additional keyword arguments passed to
pygmt.Figure.plot.
Examples
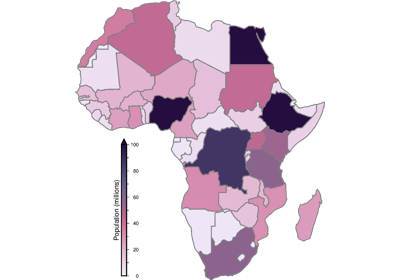
>>> import geopandas as gpd
>>> import pygmt
>>> world = gpd.read_file(
...     "https://naciscdn.org/naturalearth/110m/cultural/ne_110m_admin_0_countries.zip"
... )
>>> world["POP_EST"] *= 1e-6  # Population in millions
>>> fig = pygmt.Figure()
>>> fig.basemap(region=[-19.5, 53, -38, 37.5], projection="M15c", frame=True)
>>> pygmt.makecpt(cmap="bilbao", series=(0, 270, 10), reverse=True)
>>> fig.choropleth(world, column="POP_EST", pen="0.3p,gray10")
>>> fig.colorbar(frame=True)
>>> fig.show()